I am trying to do the question for: SIEM Visualization Example 4: Users Added Or Removed From A Local Group (Within A Specific Timeframe) and I am running into issues.
Navigate to http://[Target IP]:5601, click on the side navigation toggle, and click on "Dashboard". Extend the visualization we created or the "User added or removed from a local group" visualization, if it is available, and enter the common date on which all returned events took place as your answer. Answer format: 20XX-0X-0X
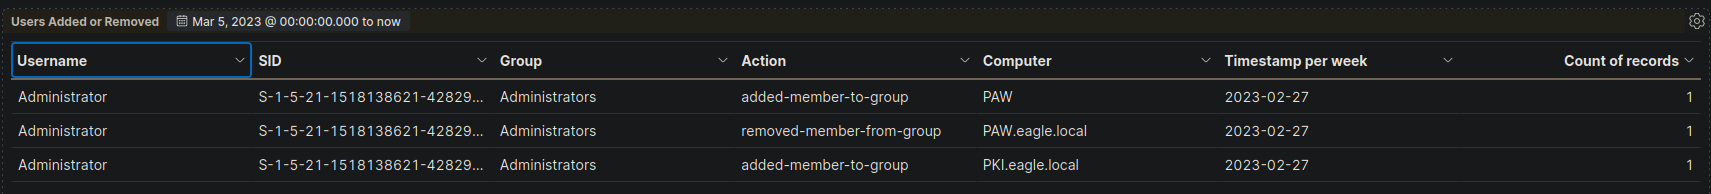
It had me set a custom date range: As discussed, we want to monitor user additions or removals from the local “Administrators” group within a specific timeframe (March 5th 2023 to date).
But when I do this it returns three (3) values all occurring on 2023-02-27. When I remove the custom date filter it does not return any value taking place after 2023-03-05 so I am not able to successfully answer the question.
Filters:
event.code is one of 4732, 4733
group.name: administrators
Is this an academy issue or am I doing something wrong. Any insight is appreciated
So I just did a brute force and the answer does not match any of the values provided in @timestamp, event.created, or event.ingested. The answer is the filter date (2023-05-03) for anyone that comes across this and is stuck.
Let’s all hope this is not a consistent issue across the board
It is an actually working question…
The automatic grouping range for the date is automatically set to 30 days without further editing. it can be changed with the toggle underneath the field selection like this:
Select toggle: Customize time interval (it is located just underneath the field in which one selects @timestamp-field to be displayed in the Table)
Set Minimum Interval to 1 and days
it then results in valid output which answers the question.